In this application the classification of spectra of retinal images can be examined.
The classification is based on one- and two-dimensional self-organizing maps. User can choose the
desired number of units in map ("10"-"60"). However, this amount is not exact in all cases.
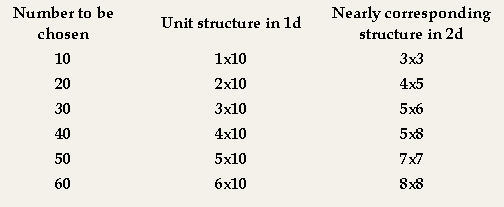
In the case of one-dimensional map the number of units is the same as the chosen value. However, in the case of two-dimensional map
there is small variation in the cases of "10", "50" and "60" units. The corresponding real numbers of units are "9", "49" and "64".
The reason is that in two-dimensional cases the width of the map is wanted to be as close to the height of the map as possible.
The map structures corresponding to the unit numbers to be chosen are shown below.

The training data for the constructed maps has eiher been same for all three images or has been collected separately for each image from the image in question. Maps trained by the latter kind of data are denoted by x - such as "10x". In this application the most of the background spectra has been removed from the training data. The color-coded image is generated by finding the closest unit to each spectrum in the spectral image and replacing the spectrum by the RGB-triplet assigned to that unit. |
Retinal Images B
 RGB channels
 Retinal Images B